Update Highlights 2025-11

Roland Wetzl
25. November 2025
Contents
New Evaluation: Cycle Time Analyses
New Widget Type: Pulse Statistics
Extended Aggregate Functions in Data Analytics
New Filter Widgets in Data Analytics
Improved Colour Coding in Data Analytics
KPI Classes in Data Analytics
More Flexible Layouts in the Production Terminal
Machine Status via Mouse-Over in the Production Terminal
Conclusion
Release Notes
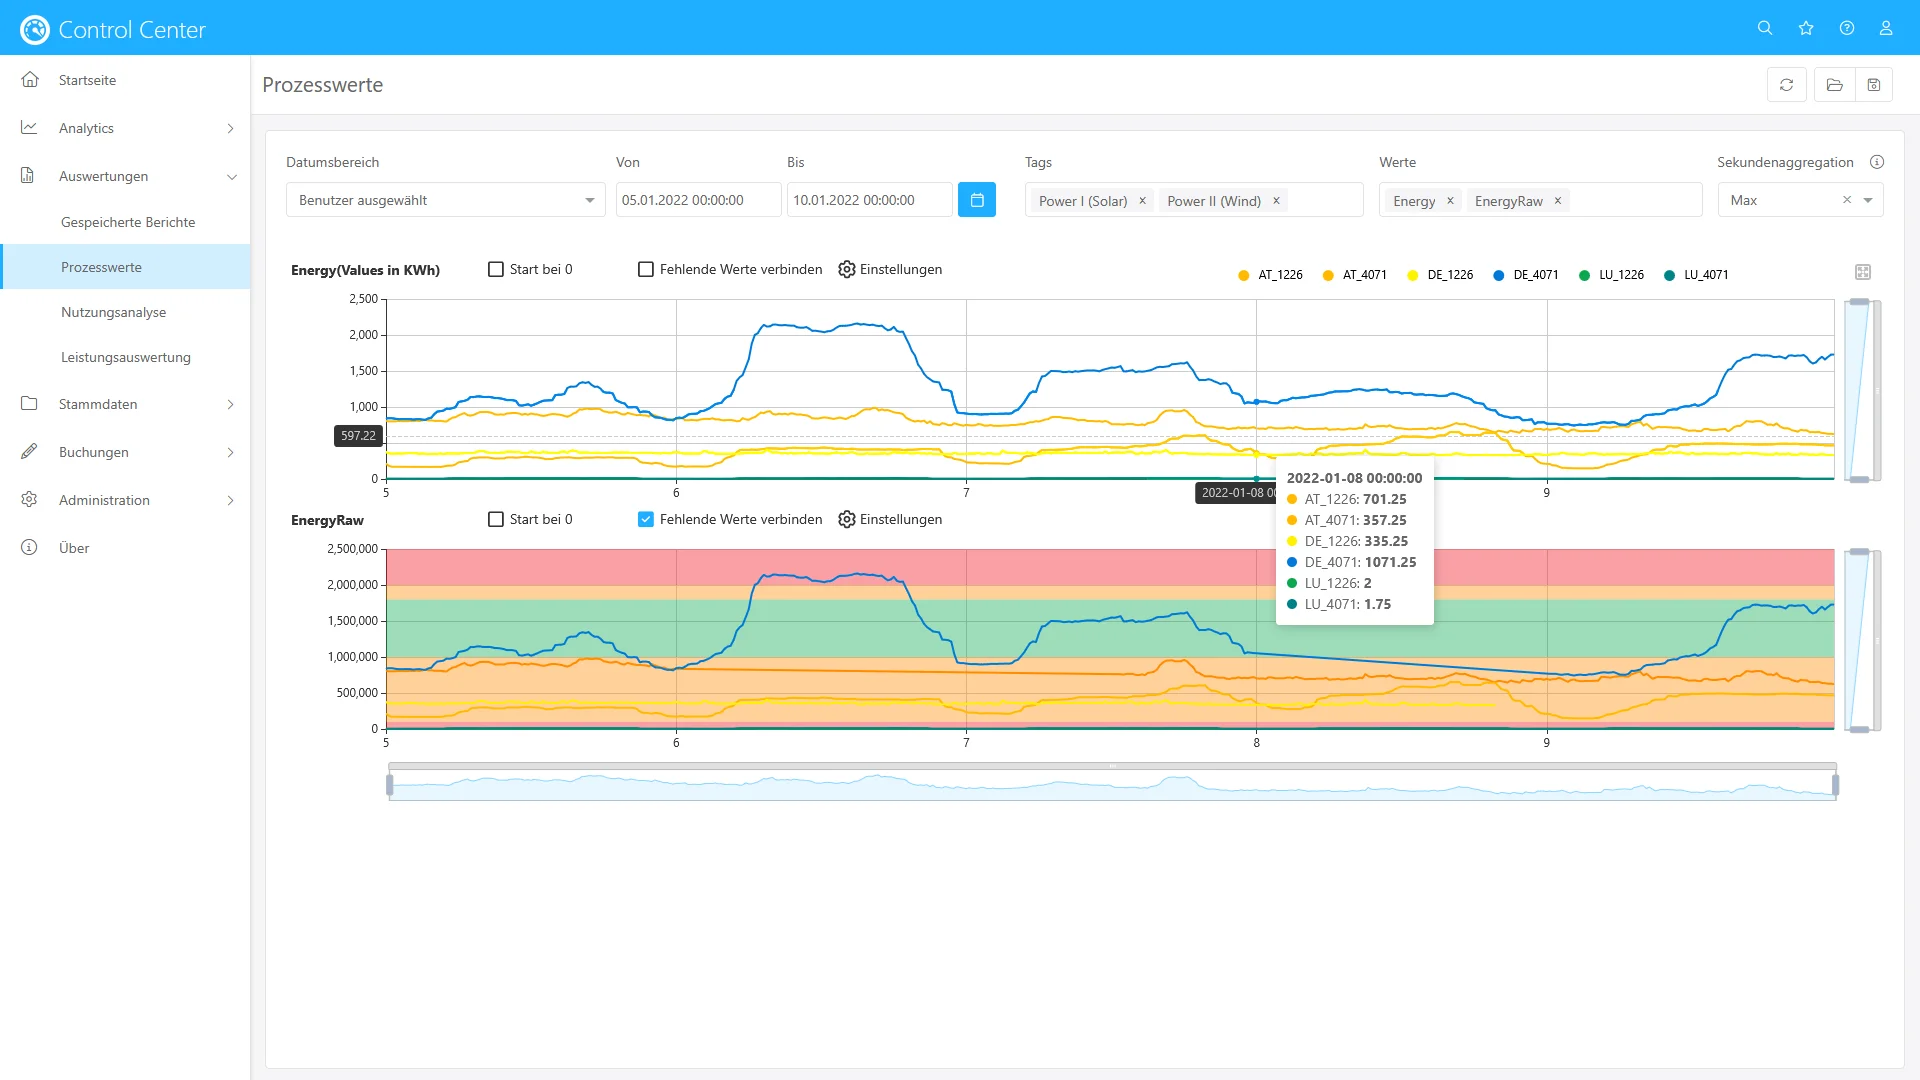
New Evaluation: Process Parameters
With the new “Process Parameters” evaluation in the Control Center, you can easily and efficiently create time-series analyses of your key process parameters in production. Control bands and intervention limits can be visualised as well – ideal for identifying process stability and deviations at a glance.
New Evaluation: Cycle Time Analyses
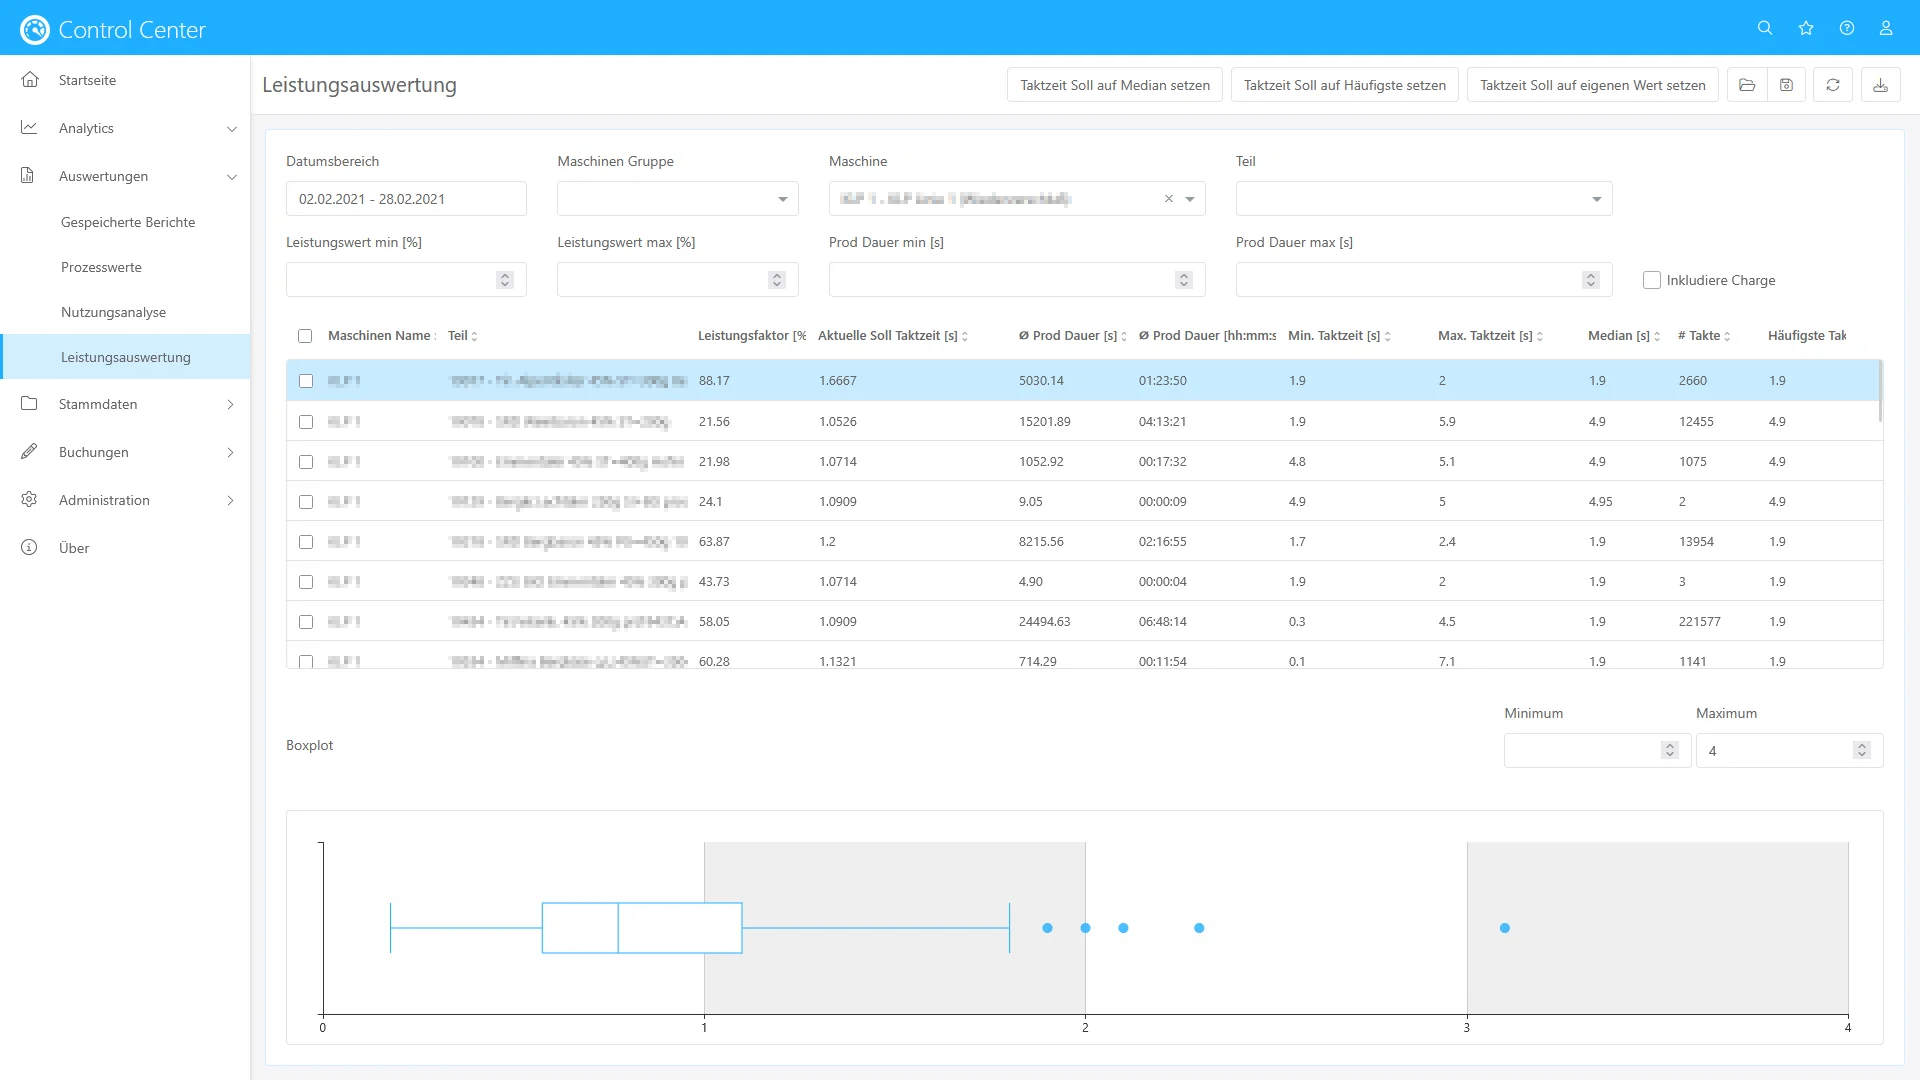
The new “Cycle Time Analyses” evaluation in the Control Center enables the calculation of statistical indicators such as average, median or standard deviation of cycle times per login.
These values can be compared directly with the current cycle time targets and adopted as a new setpoint with a single click – allowing even more precise process optimisation.
New Widget Type: Pulse Statistics
With the new “Pulse Statistics” widget type, cycle time analyses can now also be carried out in a targeted manner in Data Analytics. A bar chart displays the distribution of cycle times, while lines for the setpoint, mean and median allow the results to be interpreted at a glance.
Extended Aggregate Functions in Data Analytics
The formula editor in Data Analytics now supports additional aggregate functions such as mean, sum, minimum and maximum. This allows KPIs to be calculated even more flexibly and dashboards to be tailored more precisely to individual requirements.
New Filter Widgets in Data Analytics
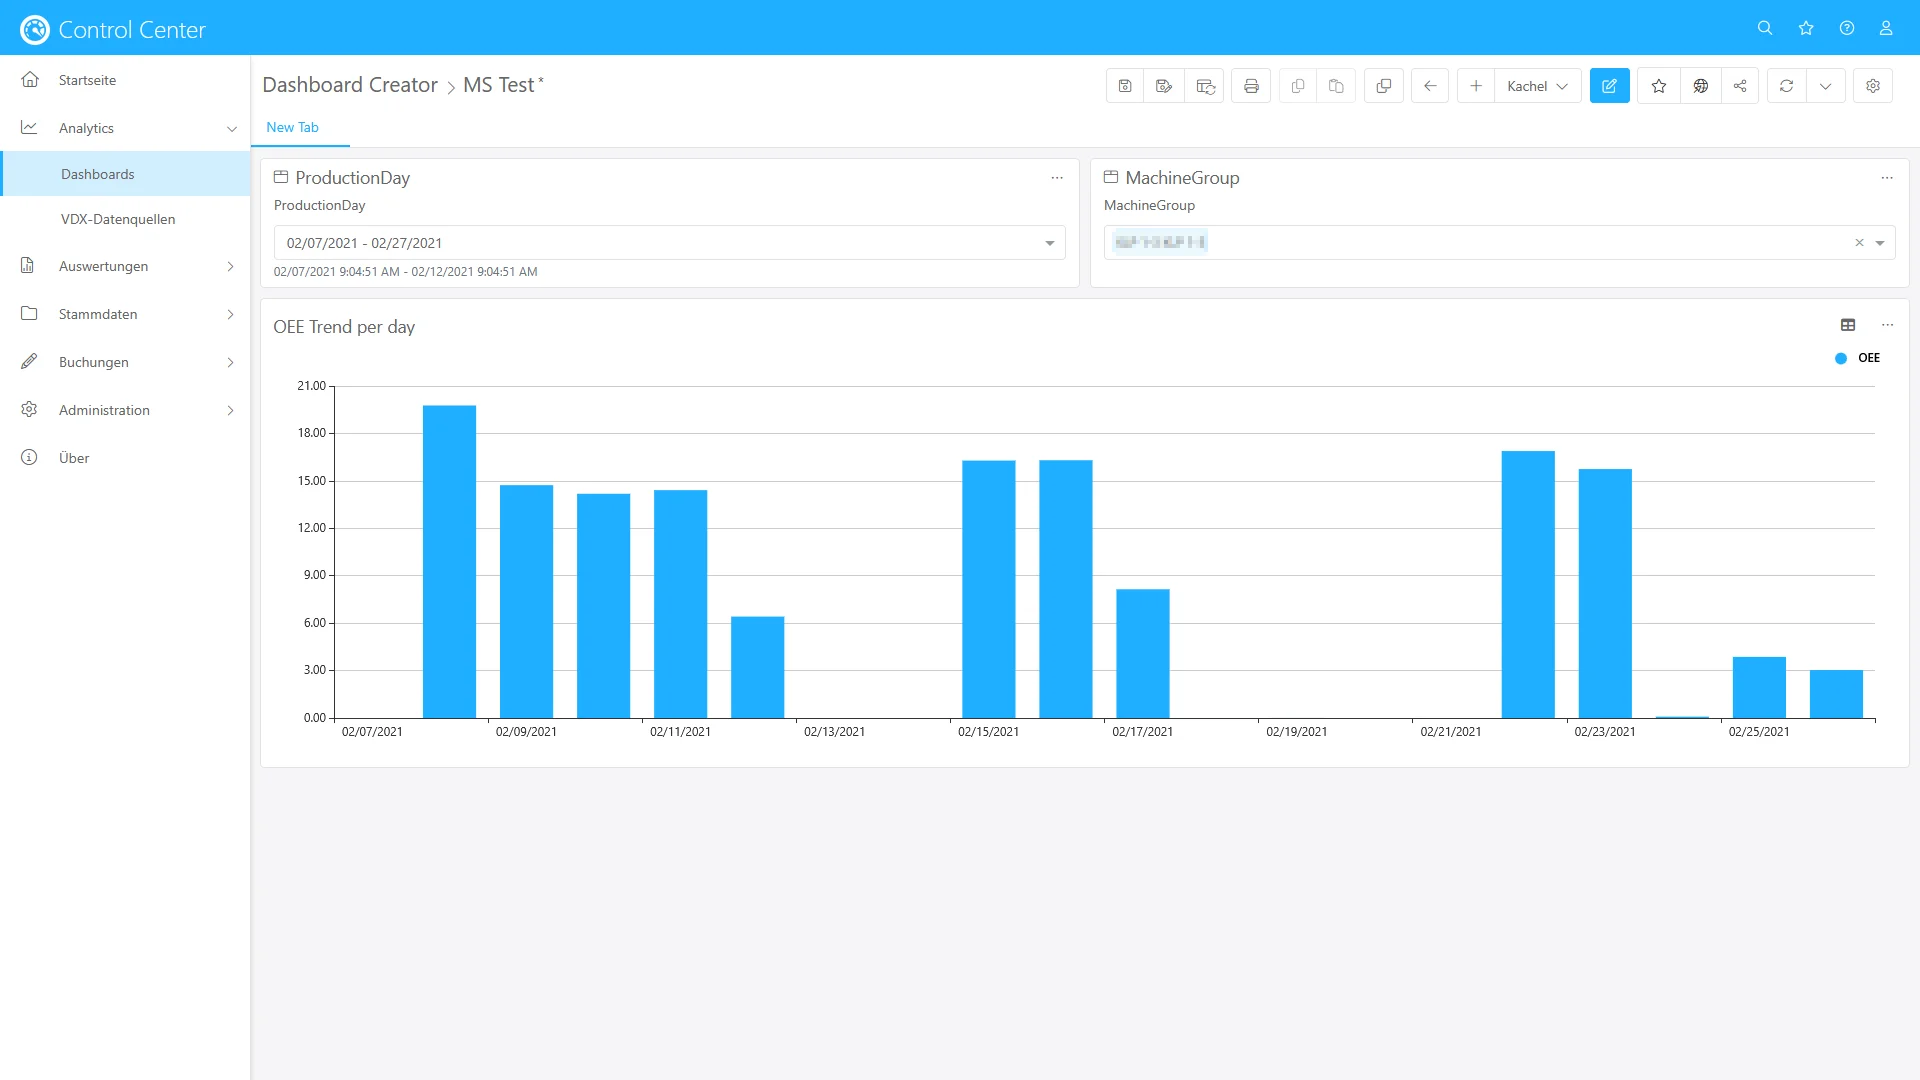
From now on, you can create your own filter widgets in Data Analytics. This allows you to design dashboards that are even more intuitive to use – ideal for departments with specific analytical requirements.
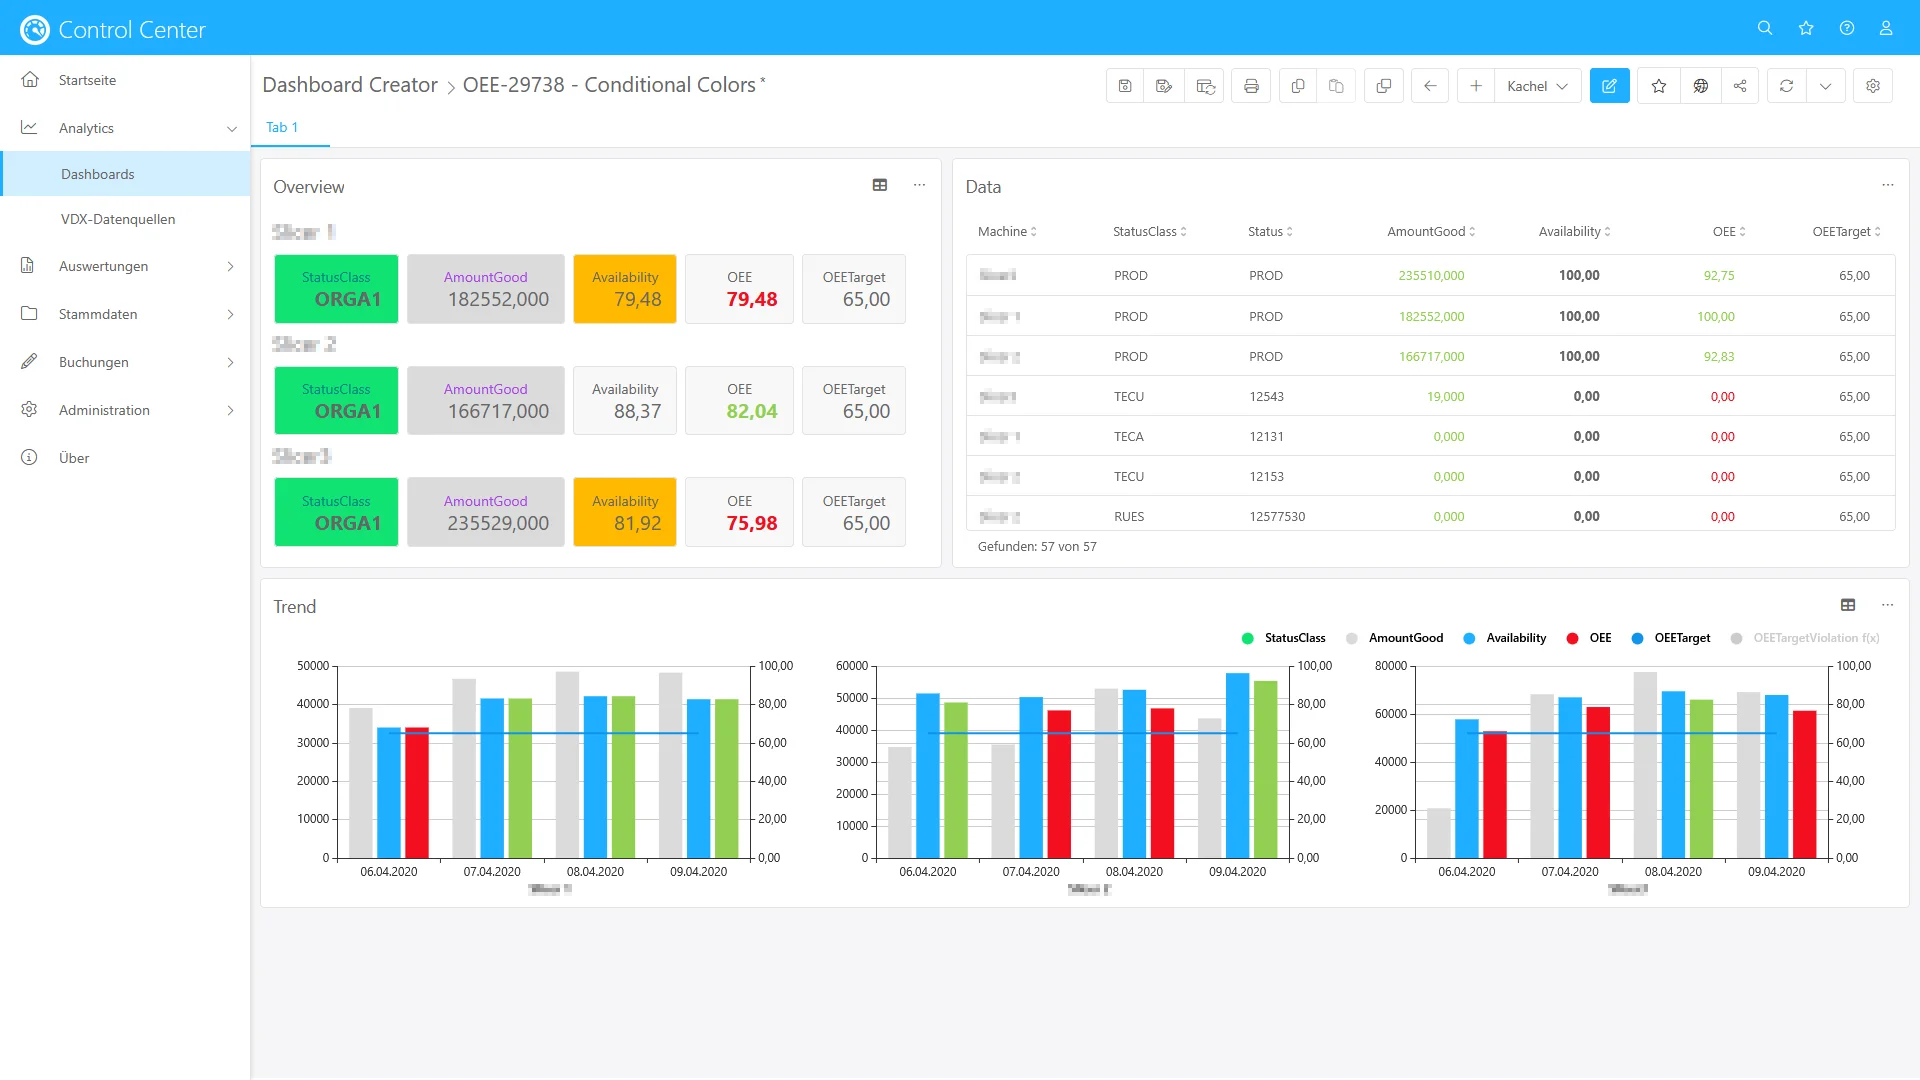
Improved Colour Coding in Data Analytics
From now on, you can create your own filter widgets in Data Analytics. This allows you to design dashboards that are even more intuitive to use – ideal for departments with specific analytical requirements.
KPI Classes in Data Analytics
In the “Logon Analysis” data source, KPI classes such as “Technical Downtime”, “Organisational Downtime” and “Changeover” are now available for direct selection. This significantly simplifies the analysis of downtime and production losses.
More Flexible Layouts in the Production Terminal
The Production Terminal now supports different zoom levels for each tile. This allows views to be customised more individually – enabling clearly structured and visually appealing layouts on any screen.
Machine Status via Mouse-Over in the Production Terminal
In the Production Terminal, a pop-up with machine status details is now displayed when hovering with the mouse or selecting via touch. This makes quick diagnostics easier and improves transparency on the shopfloor.
Conclusion
With these enhancements, we continue our journey towards making production data even more visible, accessible and user-friendly. The new features offer greater control, more flexibility – and even deeper insights into your manufacturing processes.
Stay tuned – more updates are on the way! 🚀
Release Notes
In our release notes you will find constantly updated technical information as well as information on new functions, improvements and fixed bugs in our software solutions.


