Treasure trove data


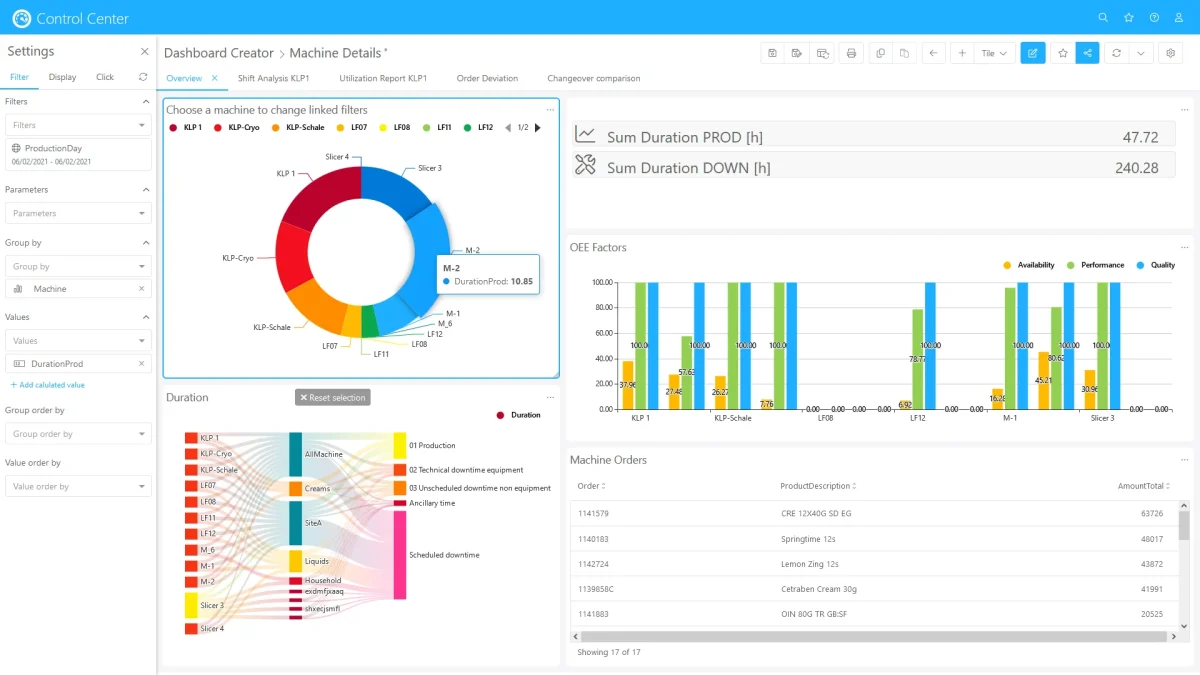
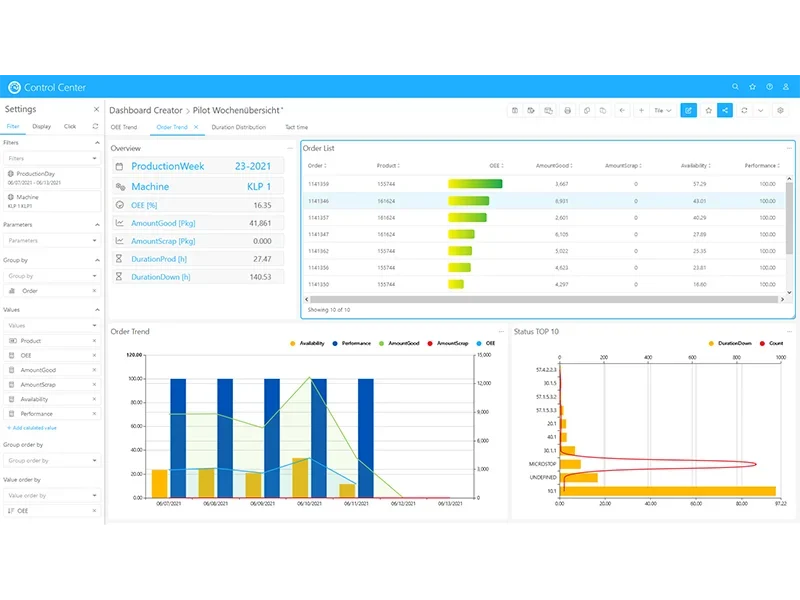
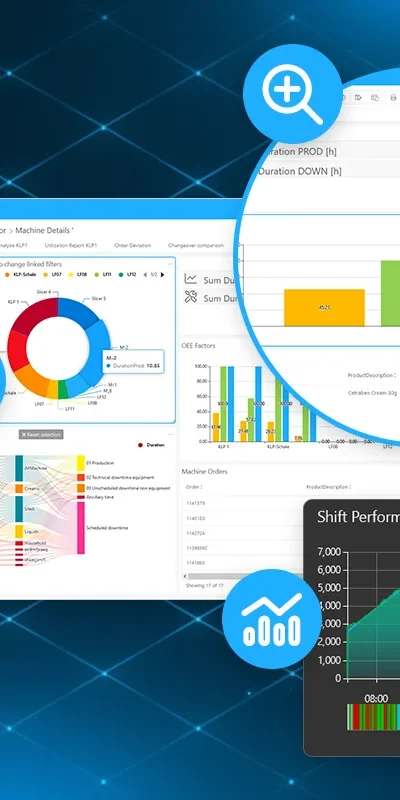
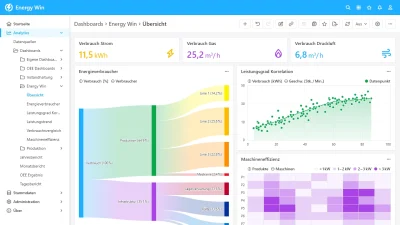
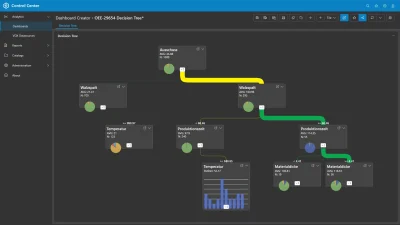
Despite increasing automation and the associated data flood the causes of errors in the manufacturing process are often left in the dark. Correlations, influence of process parameters on quality product defect or disturbance patterns on machines are hardly recognizable with standard reporting. The Visual DataXplorer is a novel analytical tool to find the causes of errors even in complex production environments rapidly.

Treasure trove data

Perfect for process engineers


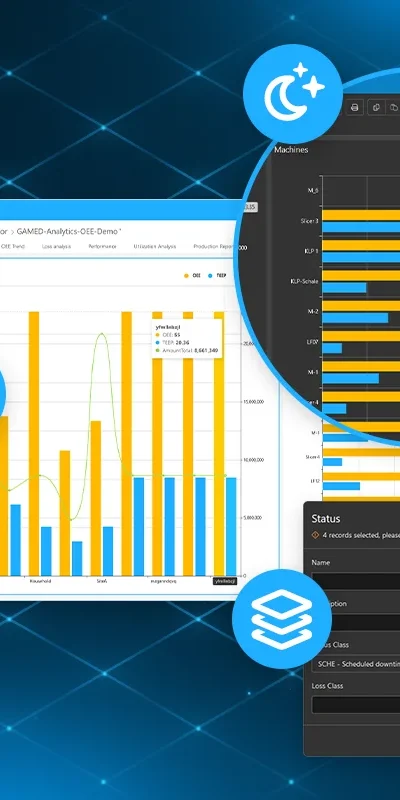
The Visual DataXplorer is tailored to the needs of process engineers. It fills the gap between business intelligence software and complex statistical software: rapid visual data analysis with inclusion of the necessary algorithms, user friendly and open to the profound knowledge of experienced process engineers.

Perfect for process engineers

Perfect for process engineers


The Visual DataXplorer is tailored to the needs of process engineers. It fills the gap between business intelligence software and complex statistical software: rapid visual data analysis with inclusion of the necessary algorithms, user friendly and open to the profound knowledge of experienced process engineers.

Focused without ballast


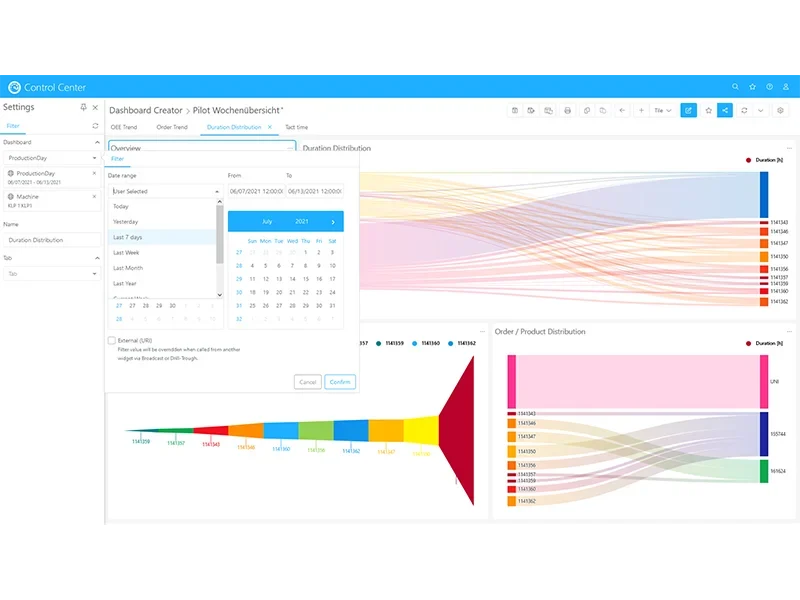
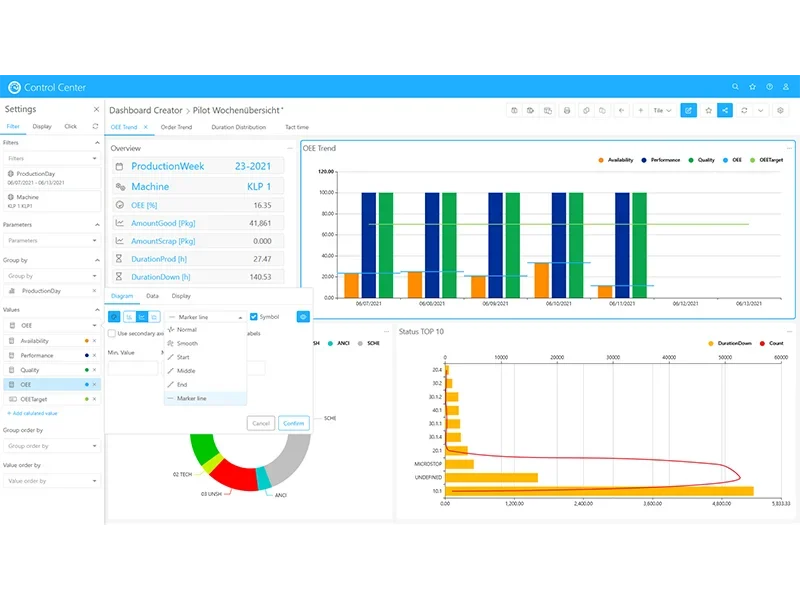
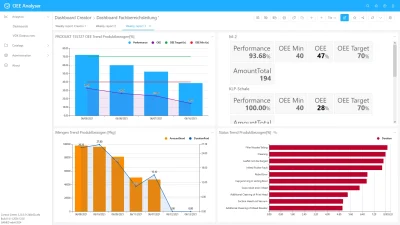
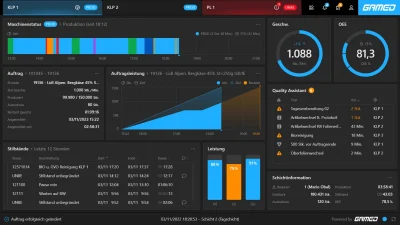
The Visual DataXplorer offers a comprehensible selection of algorithms that are especially suitable for production analysis. Through an intuitive user interface, different evaluation methods can be applied and combined. Visualization techniques enable the representation of multidimensional results on 2D screens. Depending on the detected interactions analysis process is guided step by step.

Focused without ballast

Simple data processing


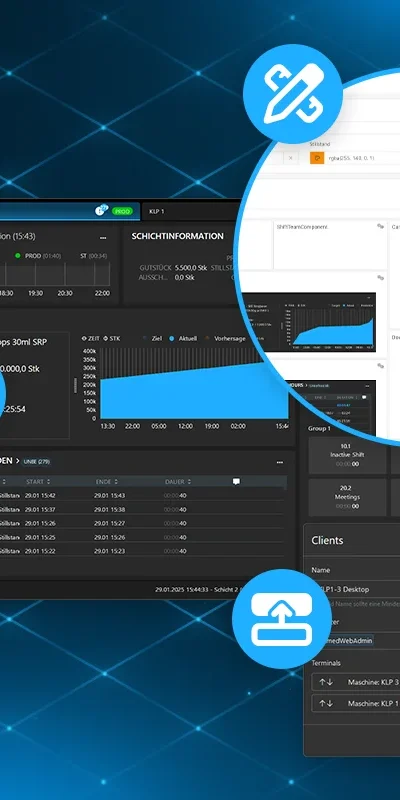
Successful analyzes require a sufficient amount of suitable data. With the DataBridge, we have a communication system that brings together data from disparate systems automatically – in real time.

Simple data processing

Simple data processing


Successful analyzes require a sufficient amount of suitable data. With the DataBridge, we have a communication system that brings together data from disparate systems automatically – in real time.

Proactive


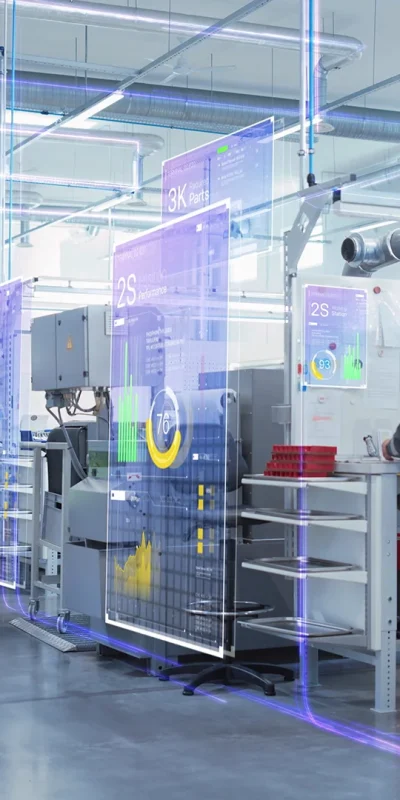
At least as useful as the analysis of historical data is a permanent early warning monitoring in production. Upon the occurrence of a critical process constellation immediate actions can be triggered and thus subsequent errors may be avoided.

Proactive

Economic benefits


  • Reduction of quality costs
  • Increase the technical plant availability
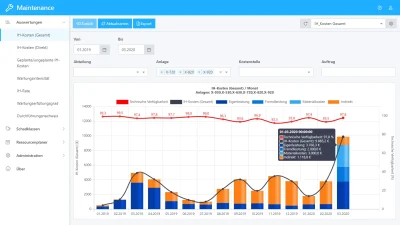
  • Optimization of the maintenance strategy
  • Improve the material/cost-efficiency

Advantages at a glance


  • No in-depth knowledge of statistics is required
  • Analyze over 100 process parameters simultaneously
  • Focused and inexpensive tool
  • Data processing and analysis operations in a very short time
  • Other algorithms and visualization methods integrable

Live Presentation


We’ll happily provide with more detailed information and present you the possibilities with the Visual DataXplorer. Please contact us.


I would like to contact GAMED and agree that my data will be used to process my request and to contact me and that my data will be stored for the necessary period of time. I acknowledge that further information about data privacy can be found in the privacy policy and agree to the statements and regulations made there.


I would like to subscribe to the GAMED newsletter.

Send 

Interested?

Get in touch


Want to find out more about you what our combination of software products and
consulting services can do for you? We’ll be happy to show you in person.
Phone
+43 316 27 86 60
E-mail
sales[@]gamed.com
Address
Harter Straße 48, 8053 Graz