


Systematically Reduce Production Losses

Roland Wetzl
29. September 2026

Sustaining Lean Production
Many manufacturing companies are already working intensively on improvement programs and the implementation of Lean Production. Yet potential often remains untapped. This is largely due to a lack of transparency and insufficient analysis of weak points.
Production losses can have many different causes: equipment failures, short stops, reduced speeds, changeover time deviations, quality problems, operator errors, search and waiting times etc.
Without reliable data, particularly in more complex multi-shift production systems, it is difficult to identify where the greatest losses occur and which measures actually have an impact.
Typical questions include:
- Why are planned targets not being met?
- Which downtime events and faults occur frequently?
- Where do speed losses occur?
- Which changeover times deviate from plan?
- Which problems cause scrap or rework?
- Where is energy being consumed unnecessarily?
Why Production Losses Are Costly
Production losses reduce productivity and have a direct impact on costs and delivery performance.
Typical consequences of production losses include:
- Rescheduling and costly additional work
- Penalties due to delivery delays
- Customer complaints
- Quality costs caused by scrap and rework
- Inventory costs due to excessive stock levels
- High repair costs
- Unnecessary energy and utility consumption
Starting Point: OEE
We recommend starting at the point of value creation: the production equipment. The OEE method has proven highly effective for this purpose across virtually all manufacturing industries. OEE is used to determine equipment productivity and systematically capture and analyze all losses.
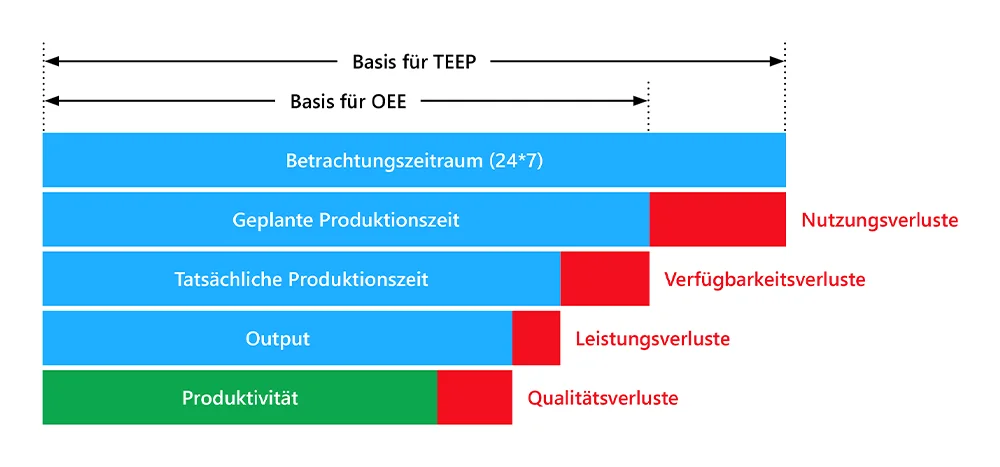
The OEE KPI consists of three factors: availability, performance and quality. TEEP additionally includes utilization.
Availability Losses
Availability losses are caused by equipment downtime during planned operating time. These include technical downtime (equipment failures) and organizational downtime such as changeovers, cleaning, waiting times etc.
Performance Losses
Performance losses occur when equipment produces more slowly than intended. These include reduced speeds, short stops, unstable processes or planned times that are not optimally defined.
Quality Losses
Quality losses are caused by scrap, rework or quality deviations within the process.
Utilization Losses
Utilization losses essentially include planned non-production time. For example, in a two-shift operation, the third shift represents a utilization loss.
From Data to Improvements
The following structure shows how production data can be turned into measurable improvements through specific measures. It is based on the GAMED approach to data-driven process optimization.
| Data Basis | Measures | Improvements |
|---|---|---|
| Current operational and process data | Real-time visualization | Transparency in production, faster response to deviations, greater awareness of losses, better process understanding |
| Order progress and order results | Update planned times, synchronize detailed scheduling, optimize scheduling for changeover times, transport control | Reduce lead times, improve on-time delivery, calculate more realistically |
| Changeover time data | SMED (Single Minute Exchange of Die) | Reduce changeover times, better prepare processes |
| Losses and waste | In-depth root cause analyses, sustainable corrective actions (continuous improvement, 8D), value stream design | Reduce costs, better meet planned targets, stabilize manufacturing processes |
| Quality problems, process and inspection data | Root cause analyses, correlation analyses, optimize inspection requirements | Reduce quality costs, meet planned targets |
| Equipment failures, equipment availability and process data | Analyze causes of failures, optimize maintenance strategies, strengthen TPM | Increase equipment availability, reduce maintenance and material costs |
Measures to Improve Performance
Improvement is not a one-time project but a continuous process. In practice, the combination of data analysis, shopfloor management and Lean methods delivers the greatest impact.
1. Make Operational Data Visible in Real Time
Current operational and process data creates transparency. When equipment status, shift performance and order progress are visible in real time, teams can respond more quickly to deviations and prevent follow-on errors.
Visualization supports process understanding and a Lean culture. Losses become tangible and can be specifically addressed in shopfloor management with effective corrective actions.
2. Analyze Downtime Systematically
To reduce downtime, it must be captured and categorized accurately. What matters is not only the duration of a downtime event but also its frequency, cause and impact on OEE.
Important questions include:
- Which faults occur most frequently?
- Which downtime events cost the most production time?
- Which machines cause recurring stops?
- Which faults occur before quality problems?
- Which causes can be permanently eliminated?
3. Analyze and Reduce Changeover Times
Changeover times affect availability, lead time and delivery performance. Analyzing changeover time data makes it possible to identify variations and systematically improve processes.
Methods such as SMED (Single Minute Exchange of Die) help analyze changeover processes, better prepare activities and reduce unnecessary waiting times. This makes changeover processes more predictable and allows equipment to return to productive operation more quickly.
4. Improve Planned Times and Detailed Scheduling
Analyzing actual runtimes makes it possible to optimize the planned changeover and processing times used for scheduling. This improves costing, detailed scheduling and on-time delivery.
Better synchronization between order progress, production results and planning helps identify bottlenecks earlier and use capacity more effectively.
5. Eliminate Causes of Losses with Continuous Improvement and 8D
Performance analyses show where losses occur. Sustainable improvements, however, only result when causes are analyzed systematically and measures are consistently tracked and verified.
These include:
- Root cause analyses
- Continuous improvement measures
- 8D problem solving
- Value stream design
- Effectiveness verification of implemented measures
6. Connect Quality and Process Data
Quality problems can be analyzed more effectively when quality and process data are considered together. Using exploratory data analysis, process engineers can identify which process conditions and equipment settings may lead to scrap or rework for specific products.
This makes it possible to reduce quality costs and optimize inspection requirements more effectively.
7. Manage Maintenance Based on Data
Ensuring the required technical equipment availability and preserving asset value are key maintenance responsibilities. When faults, runtimes and process data are systematically analyzed, maintenance strategies can be improved more effectively and costs reduced.
These include:
- Analysis of failure causes
- Optimization of maintenance strategies
- Strengthening TPM
- Introduction of planned and autonomous maintenance
- Continuous improvement of equipment and maintainability
- Efficient spare parts management
This makes maintenance more preventive and less reactive.
How GAMED Helps
GAMED provides software and services for the entire production system. Plant-specific solutions are designed using the following software modules:
- Order management (operations, recipes, specifications etc.)
- Detailed scheduling of orders
- Order and material tracking
- Production and machine data acquisition
- Material flow and transport control
- Process monitoring
- Process-integrated inspections and quality control
- Shopfloor management and visualization
- Energy and consumption management
- Maintenance management
- Performance analyses and KPIs
- Machine learning and AI for weak-point analysis
The full impact is achieved through integration into the company’s IT environment. Production orders can be imported from the ERP system in advance and result data can be reported back promptly. Processing specifications can be transferred to machine controls at the appropriate time, while all relevant process, quality and consumption data can be captured and assigned to the respective order or product.
For a successful project, GAMED provides support throughout all project phases. Thorough planning, including a cost-effectiveness analysis, functional requirements, interface design as well as implementation and training models, provides the foundation for a profitable solution. Long-term use is ensured through ongoing support, system maintenance and continuous development.
In addition, GAMED provides coaching for improvement measures and the implementation of Lean Production methods such as SMED, TPM and value stream design.
Case Study: From OEE Data to Specific Improvement Measures
A production manager identifies that a production line frequently fails to meet planned targets. At first glance, unplanned downtime appears to be the problem. Only a detailed analysis reveals that several types of losses are interacting: short stops, fluctuating changeover times, reduced speeds and individual quality deviations.
A real-time OEE analysis makes the sources of these losses visible. The data shows which causes of downtime consume the most production time and which orders show unusual deviations.
Based on this information, targeted measures are defined:
- Causes of failures are analyzed according to priority
- Changeover processes are optimized using SMED
- Planned times are updated
- Shopfloor meetings use current KPIs
- Maintenance investigates recurring equipment failures
- Quality data is compared with process data
- Continuous improvement measures are tracked and their effectiveness verified
The result is not one major leap but a measurable, step-by-step improvement in production. The line’s productivity was increased by more than 10%. Using the same resources, the company can now produce 10% more sellable products and thereby increase its contribution margin.
FAQ / Q&A
Frequently Asked Questions about Production Losses
-
What Does OEE Mean?
OEE stands for Overall Equipment Effectiveness and describes the overall effectiveness of production equipment. The KPI consists of availability, performance and quality and shows how effectively equipment is used relative to planned production time.
-
What Does Improving OEE Mean?
Improving OEE means identifying and systematically reducing losses in availability, performance and quality. This involves analyzing downtime, performance deviations, scrap and other causes of losses and minimizing them through targeted measures.
-
Which Measures Improve Productivity?
Typical measures include preventing downtime, optimizing changeover times, visualization, detailed scheduling that minimizes changeovers, continuous improvement, 8D, TPM, shopfloor management, quality data analysis and value stream optimization.
-
What Does Continuous Improvement Mean in Production?
Continuous improvement is an ongoing process of analyzing production processes and improving them step by step. OEE data helps identify the most significant causes of losses, prioritize improvement measures and verify their effectiveness.
-
What Is the 8D Method?
The 8D method is a standardized eight-step approach to systematic problem solving (D1 through D8). It is frequently used for quality problems, recurring failures or customer complaints and helps teams systematically describe problems, implement immediate containment measures, analyze root causes and document permanent corrective actions.
-
What Does TPM Mean?
TPM stands for Total Productive Maintenance. Its goal is to improve equipment availability, maintainability and process stability. Production and maintenance teams work more closely together to reduce failures, improve planned maintenance and use equipment more efficiently over the long term.
-
How Can Downtime Be Reduced?
Downtime can be reduced by systematically capturing and categorizing events and analyzing them by cause, duration and frequency. This makes it clear which failures should be addressed first.
-
What Are OEE Losses?
OEE losses occur in the areas of availability, performance and quality. They include unplanned downtime, reduced speeds, micro-stops, changeover times, scrap and rework.
-
Why Is Real-Time Data Acquisition Important?
Real-time data helps identify deviations immediately and enables faster responses. It provides transparency into machine status, production progress, downtime and quality problems.
-
How Does OEE Help Reduce Costs?
OEE shows where production time, materials, energy or capacity are being lost. Systematically reducing these losses can lower production costs and improve the utilization of existing equipment.
-
What Role Does Lean Production Play?
Lean Production helps systematically reduce waste. Since many different methods are available, performance analyses are important for identifying the areas with the greatest improvement potential and addressing them systematically.
-
What Does SMED Mean?
SMED stands for Single Minute Exchange of Die and is a Lean Management method for optimizing changeover times. After existing changeover processes have been recorded, the team defines methods for better preparation and for reducing the actual changeover process. These improvements are then established as the new changeover standard.
-
How Is OEE Related to Equipment Availability?
Equipment availability is one of the three OEE factors. It indicates how much of the planned production time is actually used for production. Downtime and failures reduce availability and therefore OEE.
-
Can OEE Be Improved without an MES?
Yes, in principle. However, without an automated data foundation, analysis is often incomplete, delayed or requires significant manual effort. An MES helps reliably capture OEE data, make causes of losses visible and prioritize measures based on data.
-
How Does GAMED Support OEE Improvement?
GAMED supports manufacturing companies with MES, OEE and shopfloor solutions. Production data, machine statuses, downtime, quality data and order information are consolidated, visualized and made available for data-driven improvements.